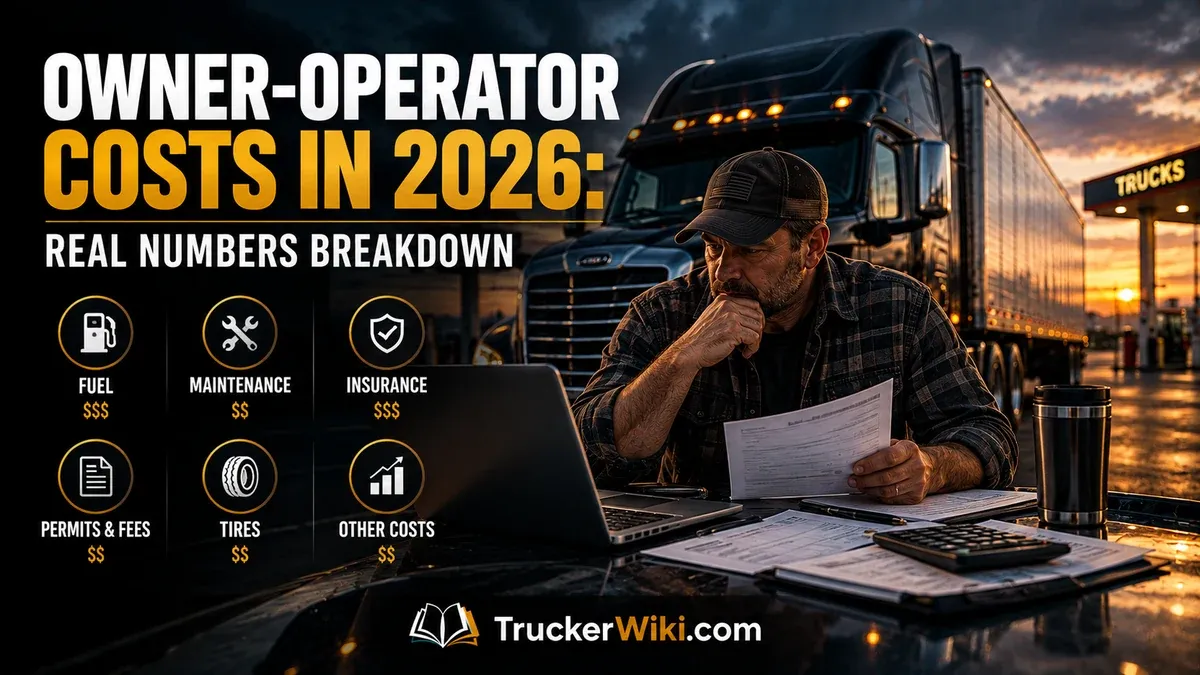
Owner-Operator Costs in 2026: Real Numbers Breakdown
When someone says they make “$5,000 a week trucking,” they almost always mean gross revenue. After fuel, insurance, truck payments, maintenance, compliance fees, and everything else that runs continuously whether the truck is loaded or empty, the actual take-home might be $1,500 to $2,500.
The gap between gross revenue and net income is where most new owner-operators encounter their first serious financial problem: they know money is coming in, but they do not know where it is going fast enough to stop it from disappearing.
This article presents the real cost numbers from authoritative industry sources: ATRI’s Operating Cost of Trucking study (2024, the most recent comprehensive dataset), ATBS owner-operator financial benchmarks, and 2026 market data across insurance, fuel, and equipment categories.
The goal is a cost model grounded in data rather than aspirational math, covering both the ongoing monthly cost structure and the startup capital requirements for new authority operations.
The ATRI Benchmark: What Industry Data Shows for Total Operating Costs
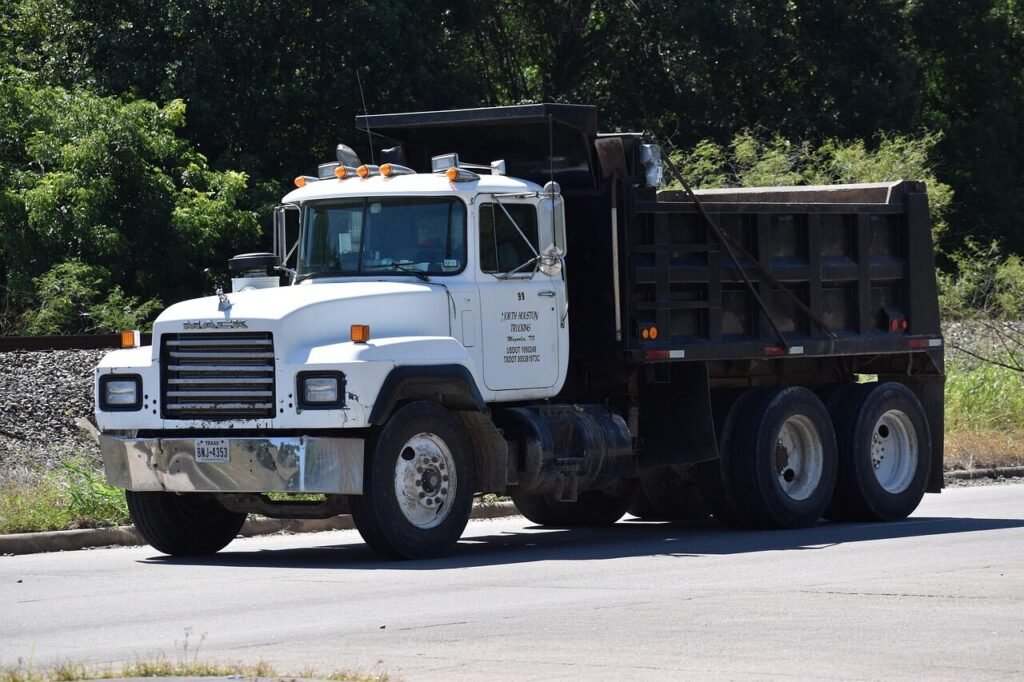
The American Transportation Research Institute (ATRI) publishes the most authoritative annual cost study in the trucking industry. Its most recent dataset covers 2024 and represents the standard industry benchmark against which individual owner-operators can compare their own cost structure. According to ATRI’s 2025-2026 data cited by AtoB and O Trucking, total operating costs for owner-operators averaged $2.26 per mile in 2024.
The five largest cost categories by cost per mile, from highest to lowest:
| Cost Category | 2024 ATRI Cost Per Mile |
|---|---|
| Driver compensation (self-pay) | $0.798/mile |
| Fuel | $0.481/mile |
| Truck and trailer payments | $0.390/mile |
| Repair and maintenance | $0.198/mile |
| Insurance premiums | $0.102/mile |
Source: ATRI Operating Cost of Trucking, as cited in AtoB owner-operator statistics (March 2026).
The driver compensation line is the largest cost category and the most misunderstood. For an owner-operator, “driver compensation” means what you pay yourself. It is not a fixed cost in the traditional sense; it is what remains after fixed and variable costs are paid.
The ATRI benchmark of $0.798 per mile represents what the average owner-operator in the study effectively paid themselves (including business profit) per mile driven. An operator who earns less than this figure per mile in net income after all other costs is paying themselves below the industry average for the miles they drive.
Two data points from the remaining table warrant specific attention. First, insurance at $0.102 per mile was a record high in 2024, and AtoB reports that nuclear verdict awards (jury awards exceeding $10 million) surged 52 percent in 2024, which is the primary structural driver behind rising commercial trucking premiums.
The $0.102 per mile insurance figure will likely remain elevated or increase further in 2026. Second, non-fuel costs reached a record high of $1.779 per mile in 2024, meaning even if an owner-operator had zero fuel cost, they would still be spending more per mile on other categories than the total operating cost was a decade ago.
The ATRI figure of $2.26 per mile is an average across all owner-operators in the study sample. An individual operator’s cost per mile will be higher or lower depending on truck age and fuel economy, whether the truck is financed or owned outright, insurance class (new authority versus established carrier), operating territory (fuel costs vary significantly by state), and how aggressively maintenance costs are managed versus deferred.
An operator with a paid-off truck, 3-year clean insurance history, and good fuel economy may run $1.30 to $1.50 per mile. An operator with a high truck payment, new authority insurance rates, and older equipment may run $1.90 or more per mile.
Fixed Costs: The Floor Your Revenue Must Clear Every Month
Fixed costs are the expenses that occur whether the truck moves or sits. A truck with an engine problem that sits for a week still generates a truck payment, an insurance premium, and an ELD subscription charge. Fixed costs define the minimum revenue threshold; variable costs define the efficiency ceiling.
For an own-authority owner-operator with a financed truck in 2026, the primary fixed costs are:
Truck payment. The largest fixed cost for most financed operators. A used semi-truck financed through a commercial lender or lease-purchase program in 2026 typically generates monthly payments of $2,000 to $4,000 depending on the truck’s age, purchase price, loan term, and the buyer’s credit profile.
New truck payments can reach $5,000 to $7,000 per month. Operators who own their trucks outright eliminate this cost entirely and typically see their net income increase by $24,000 to $48,000 annually, which is why paid-off trucks are the largest income-differentiating factor among experienced owner-operators.
Insurance. As covered in the Lease-On vs Own Authority and Cargo Insurance for Owner-Operators articles, the full insurance stack for a new authority operator runs $1,150 to $2,300 per month.
For established operators with 3 or more years of clean operation, rates drop significantly; AtoB reports new authority operators pay 40 to 100 percent more than established carriers. At 3 years of clean operation, many operators see their annual insurance cost decline by $5,000 to $10,000.
Compliance and regulatory. These costs are individually small but cumulative:
| Compliance Item | Annual Cost | Monthly Average |
|---|---|---|
| UCR registration (1 truck) | $59 | $5 |
| IRP apportioned registration | $500-$2,000 | $42-$167 |
| HVUT Form 2290 | $550 (80,000 lb) | $46 |
| ELD subscription | $240-$540 | $20-$45 |
| Drug testing consortium | $60-$180 | $5-$15 |
| IFTA annual registration | $0-$50 | ~$4 |
| Total compliance | $1,409-$3,379 | $117-$282 |
Accounting and bookkeeping. Owner-operators who track their own income and expenses using basic software pay $0 to $50 per month. Those who hire a trucking-specific bookkeeper or accountant pay $100 to $400 per month. Given that accurate financial records are the difference between paying the correct amount of tax and overpaying by thousands of dollars per year, accounting costs are among the highest-ROI expenditures in the owner-operator cost stack.
Variable Costs: Fuel and Maintenance
Variable costs scale with miles driven. Driving more miles increases revenue and increases variable costs simultaneously. The relationship between variable cost per mile and load rate per mile determines whether additional miles increase or decrease total profitability.
Fuel. Fuel is the single largest variable cost for owner-operators and the one most subject to volatility. At a diesel price of $4.00 per gallon and an average fuel economy of 6 MPG, a truck generates a fuel cost of $0.67 per mile.
At 8,500 miles per month, that is $5,695 per month in fuel before any fuel card discounts. At 6.5 MPG (achievable with speed limiter settings and load matching), the same monthly mileage costs $5,231, a difference of $464 per month or $5,568 per year. Fuel economy directly translates to income.
Diesel price volatility makes fuel the most unpredictable element in the cost model. An owner-operator who models their costs assuming $3.50 per gallon diesel and then operates when prices are $4.50 per gallon has a $0.17 per mile cost increase that was not in the plan. Fuel surcharge provisions in broker contracts and rate confirmations are designed to recover some of this volatility, but fuel surcharge pass-through is inconsistent in the spot market and depends on how the rate negotiation was structured.
Fuel cards with volume discounts are the most common mechanism for reducing fuel cost below the pump price. At discounts of $0.20 to $0.50 per gallon, a fuel card at 8,500 miles per month and 6 MPG saves $283 to $708 per month ($3,396 to $8,497 per year). The AtoB data cited earlier shows discounts of $0.45 to $2.00 per gallon are achievable at high-volume truck stops with the right fuel card, though the higher end of that range is more typical at large chain truck stops with preferred-network pricing.
Repair and maintenance. ATRI’s 2024 data puts the industry average at $0.198 per mile for repair and maintenance. At 8,500 miles per month, that is $1,683 per month. Many owner-operators underestimate this cost, particularly in the first year when a newer truck may generate fewer repair events.
The maintenance cost averages higher over time as the truck ages. A responsible maintenance reserve for a financed owner-operator is $0.15 to $0.20 per mile, regardless of whether the truck currently needs repairs, because the reserve is what pays for the next engine overhaul, brake job, or set of tires without destroying cash flow.
Tires deserve separate mention because they are often not in the monthly mental model. A full set of steer and drive tires on a tractor runs $2,000 to $4,000 depending on tire quality and service life. Trailer tires add to that. Amortized over their service life, tires represent $0.03 to $0.06 per mile of cost that operators who budget only for visible repair events miss entirely.
Your Break-Even Cost Per Mile and Why You Must Know It
The most useful financial calculation an owner-operator can perform is their own cost per mile. Without it, there is no way to evaluate whether a given load rate is profitable, marginal, or actually generating a loss.
The formula: (Total monthly fixed costs + Total monthly variable costs) / Total monthly miles = cost per mile
Example at 8,500 miles per month with a $3,000/month truck payment, $1,700/month insurance, $5,695/month fuel (at $4.00/gallon, 6 MPG), $1,600/month maintenance reserve, and $200/month compliance and accounting:
Total monthly costs: $12,195. Cost per mile: $1.43/mile.
At that cost per mile, any load paying over $1.43 per mile generates a net profit. A $2.00 per mile load generates $0.57 per mile net, or $4,845 per month before income and self-employment taxes. A $1.80 per mile load generates $0.37 per mile net, or $3,145 per month. A $1.30 per mile load generates a loss of $0.13 per mile.
American Truckers LLC’s CPM ranges provide useful benchmarks: under $1.30 per mile is excellent (owner-operators with paid-off trucks); $1.30 to $1.60 is typical for a financed truck with a clean operation; $1.60 to $1.90 is tight; above $1.90 is a danger zone requiring rates consistently above $2.60 per mile to generate meaningful income.
The average own-authority owner-operator grosses $150,000 to $300,000 annually but takes home $50,000 to $100,000 after expenses, according to ATBS financial benchmarks. ATBS reports the average net income for owner-operators in their database at approximately $64,524 per year. This figure includes operators with paid-off trucks and those with high truck payments; the median for financed operators running at market rates is lower.
These numbers explain a dynamic that many new owner-operators find jarring: the same lanes, the same rates, and the same number of miles can produce either a profitable business or a losing one depending almost entirely on cost structure.
An operator with a $1,500/month truck payment, $1,100/month insurance (established carrier rate), and 7.5 MPG fuel economy might run a break-even CPM of $1.22. An operator running identical lanes and rates but with a $3,500/month truck payment, $2,000/month insurance (new authority rate), and 5.8 MPG fuel economy might run a break-even CPM of $1.72.
At $2.10 per mile gross, the first operator keeps $0.88 per mile; the second keeps $0.38 per mile. Over 100,000 miles per year, that is the difference between $88,000 and $38,000 in gross profit before taxes, from the same miles at the same rates. The cost structure is the business; the loads are just revenue.
Startup Costs: What You Need Before the First Load
The cost discussion above covers ongoing operations. Startup costs are the one-time and first-year costs that a new own-authority operator must fund before the truck generates revenue.
Government and regulatory fees: USDOT number (free), MC authority ($300), BOC-3 ($25-$75), UCR ($59), IRP ($500-$2,000 first year), HVUT ($550 if applicable). Total: approximately $1,434 to $2,984.
First-year insurance. For a new authority operator, annual insurance costs run $14,000 to $22,000 for the full stack (liability, cargo, physical damage, occupational accident, bobtail/NTL). This is paid monthly but represents a committed annual expense.
Operating capital beyond equipment. Per O Trucking’s 2026 analysis, new owner-operators need a minimum of $20,000 to $25,000 in operating capital beyond the truck purchase, covering the MC authority startup fees, first-month insurance, and 60 to 90 days of operating expenses during the period when broker access is limited and loads may be harder to book. This reserve is not discretionary; it is the financial buffer that prevents a slow freight week from cascading into missed truck payments and defaulted insurance.
Equipment. A used semi-truck in 2026 ranges from $40,000 to $150,000 depending on year, mileage, and condition. A truck financed at $80,000 over 60 months at 8 percent interest generates approximately $1,622 per month in payments. Add a trailer purchase or lease if the operator plans to provide their own trailer.
Lease-purchase arrangements from carriers should be evaluated carefully; O Trucking warns that many lease-purchase deals result in owner-operators paying $150,000 or more for a truck worth $80,000. A lease-purchase that seems affordable at $1,800 per month can run for 5 to 7 years and cost more than a cash purchase of a better truck would have.
Undercapitalization is the single most common reason new owner-operators fail within the first year. A new operator who purchases a truck with minimal down payment, starts with high insurance costs, encounters the 60 to 90 day broker access limitation, and has no cash reserve has a structural problem that better freight rates cannot solve. The operators who succeed past the first year almost universally either start leased-on to build capital first, or bring $30,000 to $50,000 in cash reserves beyond the equipment purchase.
The financial calculation that matters most before entering own authority is not “how much can I gross?” but “what are my fixed costs, and at what miles-per-month and rate-per-mile do I break even?” An operator who knows their break-even CPM can evaluate every load objectively.
An operator who does not know their break-even CPM is running loads that may be costing them money without knowing it, and that gap compounds over months until cash reserves are gone and equipment payments are delinquent. Building the cost model before the first dispatch is the most important financial preparation a new owner-operator can do.
For context on the compliance and insurance costs discussed here, see the Owner-Operator Guide: Start Your Trucking Authority and the Lease-On vs Own Authority articles.
By TruckerWiki Editorial Team | Data sources: ATRI Operating Cost of Trucking 2024, as cited by AtoB owner-operator statistics (March 2026), O Trucking owner-operator costs guide (February 2026), American Truckers LLC cost per mile (February 2026), ATBS 2024 owner-operator financial benchmarks. All cost figures are estimates based on 2024-2026 industry data and will vary by individual operator profile, geography, equipment, and operating patterns.