Top DOT Violations in 2025: FMCSA Inspection Data
The 2025 CVSA International Roadcheck produced 56,178 commercial motor vehicle and driver inspections across North America over 72 hours in May. The vehicle out-of-service rate was 22.6 percent. The driver out-of-service rate was 5.9 percent. Combined, these figures mean that roughly 1 in 5 vehicles inspected was placed OOS, and nearly 1 in 17 drivers was placed OOS.
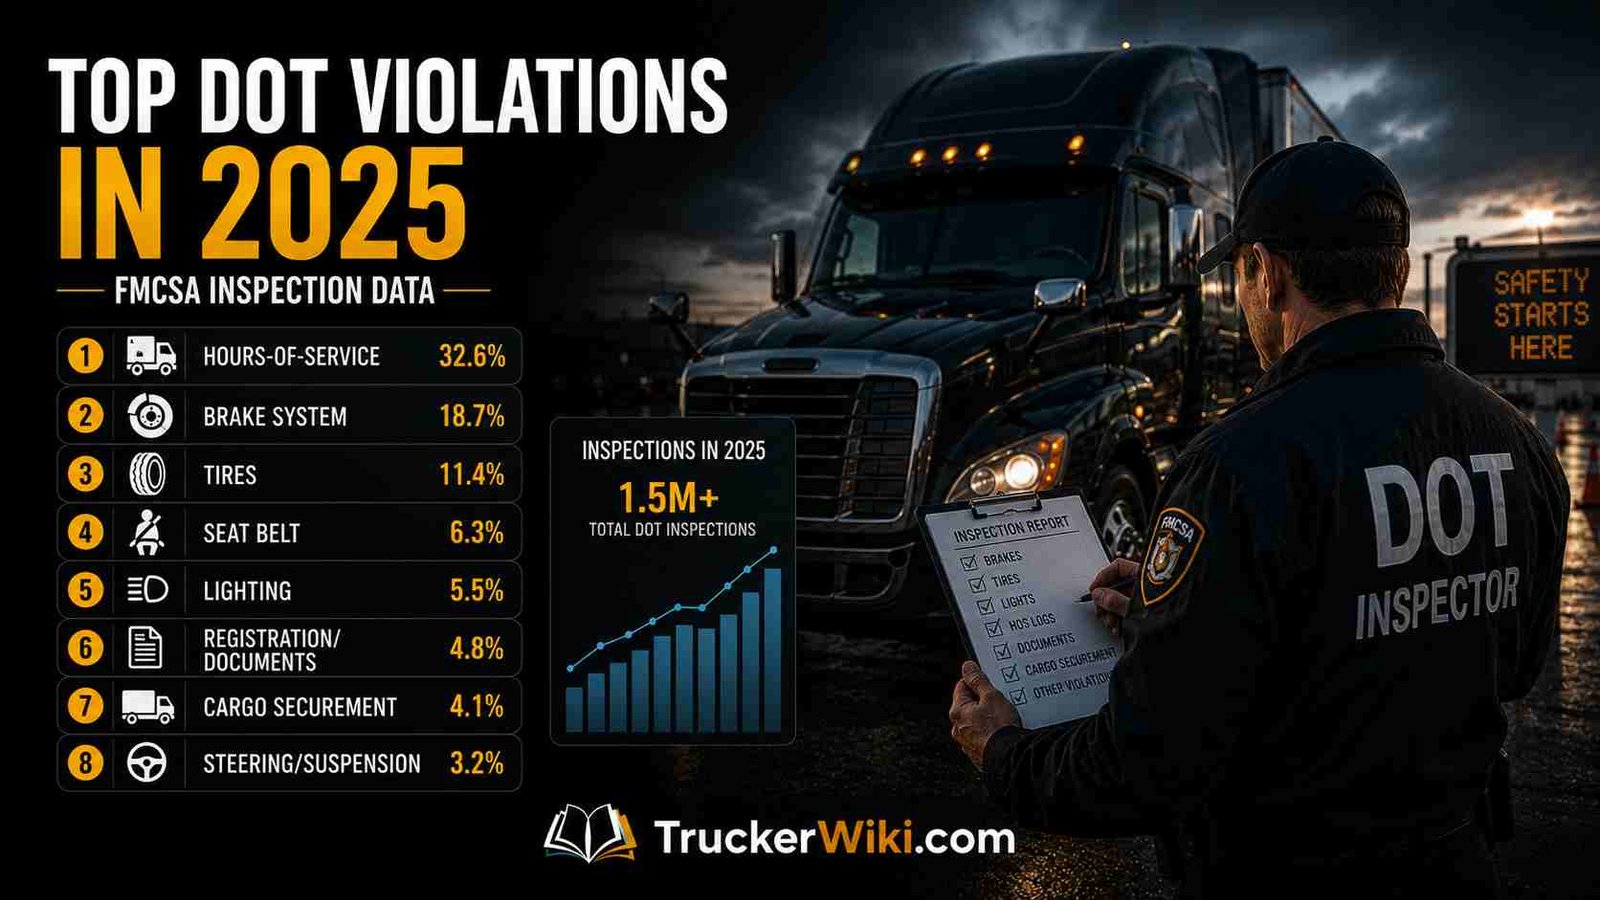
The data from the Roadcheck, combined with FMCSA’s full-year 2025 roadside inspection violation dataset, reveals the same violation patterns that have dominated enforcement findings for multiple consecutive years. Every violation category that led the 2025 data also led in 2024 and 2023. These are not compliance surprises. They are predictable, preventable maintenance and documentation failures.
This article presents the 2025 enforcement data organized by violation category, explains why certain categories dominate year after year, and connects the 2025 full-year data to the 2026 Roadcheck enforcement priorities that the numbers directly produced.
For context on how these violations affect the CSA Safety Measurement System and BASIC percentiles, see the CSA Score Explained article. For the specific conditions that produce OOS orders, see the Out-of-Service Violations: Full Driver List.
The 2025 Roadcheck: Vehicle and Driver OOS Rates in Context

The 2025 International Roadcheck ran May 13-15 at weigh/inspection stations and mobile enforcement sites across the United States, Canada, and Mexico. Enforcement personnel conducted 56,178 inspections, including 44,435 North American Standard Level I, II, and V inspections that involve full or partial vehicle examination. From those Level I/II/V inspections, officers recorded 13,553 vehicle OOS violations and placed 10,064 vehicles out of service.
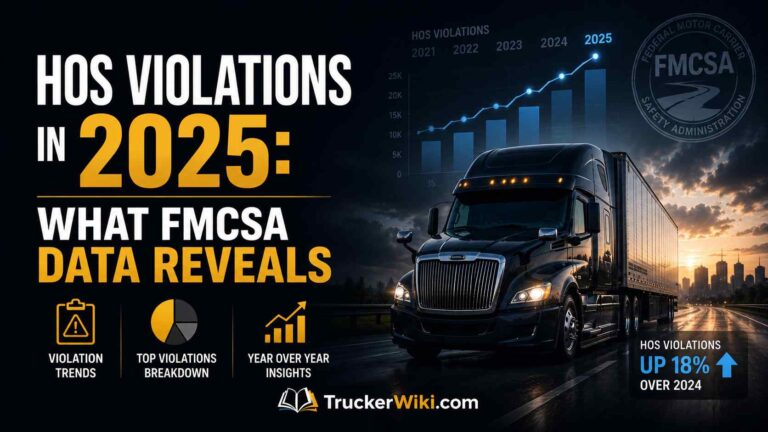
The year-over-year comparison between 2024 and 2025 shows a split trend. Vehicle compliance improved: the 2024 Roadcheck vehicle OOS rate was approximately 23 percent; the 2025 rate was 22.6 percent, a modest improvement. Driver compliance worsened: the 2024 Roadcheck driver OOS rate was 4.8 percent; the 2025 rate was 5.9 percent, a 1.1 percentage point deterioration.
Fleets that invested in preventive maintenance between 2024 and 2025 saw measurable results in the vehicle OOS statistics. The driver compliance gap widened despite the vehicle improvement, confirming what the broader HOS violation data analysis found: the ELD and records compliance problem did not improve after the mandate took full effect.
The 2025 Roadcheck used a targeted special driver focus on false records of duty status, the first dedicated RODS enforcement focus in the Roadcheck program’s history. Inspectors were specifically trained to cross-reference ELD data against supporting documents and to identify ELD-specific anomalies. The 2025 Roadcheck vehicle focus was tires, which moved tires from a general inspection priority to a named focus category with dedicated inspector attention.
Top Vehicle Violations: Brakes Lead Every Year, Tires Second in 2025
The vehicle violation data from the 2025 Roadcheck is consistent with the pattern that has held for at least a decade. No enforcement campaign, rule change, or industry initiative has shifted brakes from the top OOS category. The 2025 data:
| Vehicle OOS Category | 2025 Roadcheck OOS Count | Share of Vehicle OOS |
|---|---|---|
| Brake systems (adjustment, condition, lines) | 3,304 | 24.4% |
| Tires (tread depth, flat, damaged, improper) | 2,899 | 21.4% |
| 20% or more defective brakes (combined brake standard) | 2,257 | 16.7% |
| Cargo securement | ~1,490 (est.) | ~11% |
| Lighting (headlights, taillights, brake lights, markers) | Not separately reported | 3rd/4th category |
| Wheel and rim components | Not separately reported | Top 5 |
Source: CVSA 2025 International Roadcheck Results (October 2025) and FreightWaves 2026 Roadcheck preview coverage (May 2026).
The brake categories combined (brake systems at 24.4% plus 20% defective brakes at 16.7%) account for 41.1 percent of all vehicle OOS violations during the 2025 Roadcheck. No other single system comes close. This dominance is not random. Brake violations require physical under-vehicle inspection to detect accurately; only Level I and Level V inspections include this component.
Vehicles that are only ever subject to Level II walk-around inspections can accumulate brake drum wear, lining deterioration, and adjustment drift that never appear at roadside because no officer has been underneath the vehicle. The pre-trip inspection is the primary prevention mechanism, but it is not a substitute for the under-vehicle component of a formal Level I inspection.
Tires at 21.4% of vehicle OOS violations reflect the 2025 Roadcheck’s special tire focus, which almost certainly elevated tire-specific detection above what a non-focused inspection would find. The tire OOS conditions are straightforward: less than 4/32-inch tread on steer axles, less than 2/32-inch on other axles, flat tires, exposed cord, improper load ratings, and tires not rated for highway use.
Every one of these conditions is visible during a pre-trip walk-around and detectable with a tread depth gauge. The 2,899 tire OOS violations at the 2025 Roadcheck represent tires that were in the vehicle’s operating condition before those drivers left their last terminal.
Lighting is the highest-volume single violation category in the year-round FMCSA CSA dataset, accounting for more than 11 percent of all CSA violations recorded year over year, according to First Call Logistics’ analysis of the FMCSA Roadside Inspection Violations Report.
Lighting violations are predominantly cited as non-OOS conditions (a single burned-out clearance light is a citation, not typically an OOS). The high annual volume of lighting citations reflects how frequently drivers operate with inoperative lights and how consistently officers cite them.
A non-functional brake light is an OOS condition; a non-functional marker light is typically not. The distinction matters for OOS rate analysis, but both enter the Vehicle Maintenance BASIC.
Top Driver Violations: HOS Leads OOS, False RODS Leads Full-Year Volume
Driver-side violations at the 2025 Roadcheck were distributed across four main categories by OOS count:
| Driver OOS Category | 2025 Roadcheck OOS Count | Share of Driver OOS |
|---|---|---|
| HOS violations (11-hr, 14-hr, 60/70-hr, no records) | 1,076 | 32.4% |
| No valid CDL or wrong class | ~815 | 24.4% |
| No or expired medical certificate | ~498 | 14.9% |
| False records of duty status | 332 | 10.0% |
| Suspended CDL | ~170 | 5.1% |
Source: CVSA 2025 International Roadcheck Results. Driver OOS counts are calculated from the total driver OOS of 3,342 and reported percentages.
HOS violations account for nearly one-third of all driver OOS findings at the 2025 Roadcheck, confirming that HOS compliance remains the dominant driver-side enforcement priority. The 1,076 HOS OOS orders produced over 72 hours represent drivers whose cumulative hours, daily limits, or record-keeping failures were severe enough to meet the CVSA OOS thresholds.
The false RODS figure tells a different story through the full-year data. The 2025 Roadcheck OOS finding of 332 drivers for false RODS (10 percent of all driver OOS) is the Roadcheck snapshot.
Across the full year, FMCSA’s roadside inspection data shows 58,382 false records of duty status violations in 2025, making it the second most-cited driver violation in the entire FMCSA enforcement dataset, behind only speeding-related violations in the Unsafe Driving category.
Five of the top ten driver violations in the full-year FMCSA dataset were hours-of-service or ELD-related, confirming that the HOS/ELD compliance cluster is the dominant source of driver-side violations in the current enforcement environment.
The “No valid CDL or wrong class” category at 24.4% of driver OOS findings is the most avoidable violation category in the dataset. A driver operating a Class A combination vehicle on a Class B CDL violates a requirement that existed before they started the trip.
Carrier qualification file management and pre-dispatch CDL verification should prevent this category entirely. That it accounts for nearly one-quarter of all driver OOS findings suggests widespread gaps in driver qualification file monitoring across the industry.
The expired or missing medical certificate at 14.9% of driver OOS is similarly preventable. Medical certificates have a maximum 24-month validity and an expiration date printed on the document.
A carrier with a system for tracking medical certificate expiration dates and notifying drivers 60 days in advance should not produce medical certificate OOS findings. The fact that 498 drivers were placed OOS at the 2025 Roadcheck for this reason alone represents 498 carriers whose qualification file monitoring failed to catch an expiration date that was visible on a physical document the driver was required to carry.
The full-year 2025 FMCSA data provides additional context beyond the Roadcheck snapshot. CVSA confirmed that falsification of records of duty status was the second most-cited driver violation across all FMCSA inspections in 2025, at 58,382 total violations.
Five of the top ten driver violations in the year-round FMCSA enforcement dataset were hours-of-service or ELD-related. The ELD violation data article covers the full-year ELD-specific violation data in detail.
The takeaway from the combined 2025 data is clear: driver compliance failures are concentrated in HOS/ELD and qualification categories, and both are addressable through system-level management rather than hoping individual drivers manage their own compliance without carrier oversight.
Why the Same Violations Lead Year After Year

The most striking feature of the 2025 data is how closely it mirrors 2024, 2023, and 2022. Brake systems have been the leading vehicle OOS category for at least a decade. Lighting has led to annual CSA violation volume for multiple consecutive years. HOS has led driver OOS findings in every year of the ELD mandate era. False RODS was the second most-cited driver violation in 2025 and was also prominent in 2024 data.
The persistence of these specific categories is not a regulatory complexity problem. No driver is uncertain about whether brakes need to be adjusted or whether the lights need to work. No driver is unaware that HOS limits apply to their operation.
The persistence is a maintenance and discipline problem: carriers that do not prioritize systematic brake maintenance, drivers who do not conduct thorough pre-trip inspections, and operations that create scheduling pressure leading to HOS overreach all produce the same findings year after year.
The preventability of these violations becomes more striking when viewed through the lens of the DOT pre-trip inspection requirements. Every brake adjustment violation, every tire tread defect, and every inoperative light is an item that a proper pre-trip walk-around addresses directly.
A driver who checks pushrod stroke at every pre-trip prevents brake adjustment violations. A driver who checks tread depth with a gauge prevents tire OOS orders. A driver who cycles through brake lights, turn signals, and clearance lights before every departure prevents the lighting citations that account for 11 percent of all CSA violations annually.
The multi-year data creates a specific compliance argument for carriers: the pre-trip inspection is not a regulatory checkbox. It is the primary mechanism that removes vehicles from the OOS-eligible pool before they encounter an enforcement officer.
Carriers that document their pre-trip inspections, track DVIR defect rates, and enforce same-day repair policies on cited defects consistently show lower Vehicle Maintenance BASIC percentiles than carriers that treat pre-trip inspection as an administrative formality. The data does not show a complex engineering problem. It shows a systematic pre-departure verification failure that is directly addressable.
The predictability of the violation pattern carries a specific operational implication: these violations are the most preventable failures in the fleet. A carrier that systematically addresses brake adjustment through quarterly service schedules, tread depth monitoring at every fuel stop, and pre-departure lighting checks will remove itself from the pool of vehicles producing the data discussed in this article.
The enforcement data is not a profile of hard-to-find defects or edge-case compliance questions. It is a profile of basic maintenance and pre-departure verification that was not performed.
What the 2026 Data Shows Through Roadcheck
The 2026 International Roadcheck (May 12-14, 2026) generated early data that is directly comparable to 2025. Through the first two days of the 2026 event, FMCSA inspection records aggregated by Search Carriers showed 6,406 total inspections, 11,010 violations, and 2,055 OOS orders across 5,217 distinct carriers. The per-inspection violation rate was approximately 1.7 violations per inspection, and the OOS rate against total inspection volume was approximately 32 percent on both Day 1 and Day 2.
That 32 percent OOS rate in the early 2026 data is substantially higher than the 22.6 percent vehicle OOS rate reported across the complete 2025 Roadcheck. The early-event comparison is not apples-to-apples; inspections on the first two days of an enforcement event tend to concentrate on the vehicles and drivers selected as the highest-priority targets, which may produce a higher-than-average OOS rate that moderates as the event continues. The final 2026 Roadcheck results will provide the comparable full-event figures.
The 2026 Roadcheck vehicle focus was cargo securement, reflecting the FMCSA full-year 2025 finding of 18,108 violations for cargo not secured to prevent leaking, spilling, blowing, or falling, and an additional 16,054 violations for unsecured vehicle components and dunnage, totaling more than 34,000 violations in a single calendar year.
The 2026 Roadcheck driver focus was ELD tampering, reflecting the 58,382 false RODS violations in the 2025 annual data. The choice of focus areas is a direct response to the data, which makes the 2025 violation dataset both a backward-looking enforcement record and a forward-looking signal of where enforcement attention is concentrated in 2026.
Early 2026 Roadcheck violation data showed that cargo securement violations were widespread in distribution but did not generate the extreme per-inspection violation totals found in mechanical maintenance failures.
The worst individual inspection outcomes in 2026 Day 1 and Day 2 data, with single stops producing 26 and 27 vehicle violations, respectively, were driven by brake, tire, lighting, and coupling device failures. The 2026 vehicle data reinforces what the 2025 data showed: mechanical maintenance failures remain the primary driver of the most severe inspection outcomes, regardless of which category is designated as the official enforcement focus.
Carriers that read the 2025 data and systematically address brake, tire, and lighting maintenance heading into the second half of 2026 are addressing the violation categories that consistently produce the highest per-inspection severity scores, not just the categories named on the enforcement calendar.
By TruckerWiki Editorial Team | Data sources: CVSA 2025 International Roadcheck Results, CVSA 2026 Roadcheck Focus Areas page, FreightWaves 2026 Roadcheck Day 1 Coverage (May 2026), FreightWaves 2026 Roadcheck Day 2 Coverage (May 2026), Brake Report 2026 Roadcheck preview (May 2026), First Call Logistics CSA violations analysis (citing 2023 FMCSA Roadside Inspection Violations Report). Note: 2026 Roadcheck final full-event results were not yet published as of May 2026; early data cited is from SearchCarriers.com aggregation as of May 13-14, 2026.